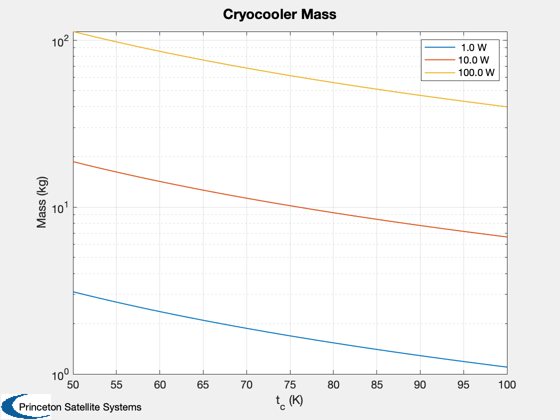
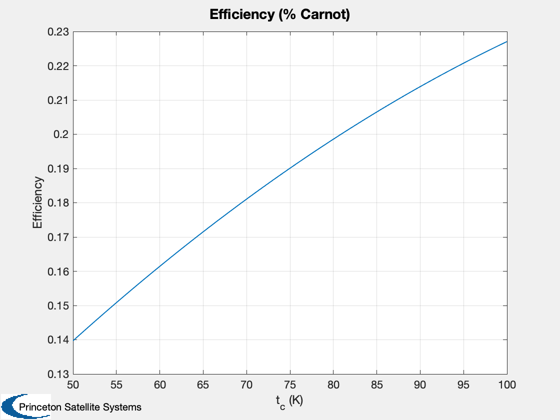
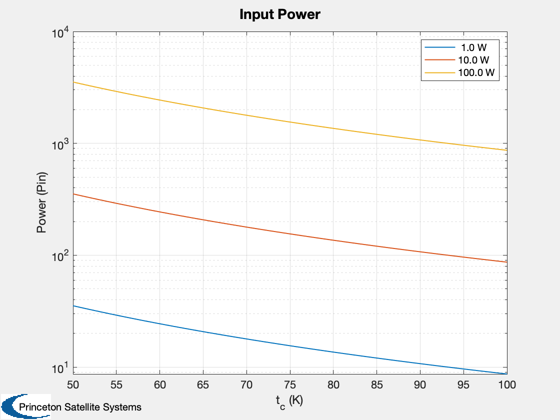
Cryocooler analysis
Plots for three values of lift heat from 50 to 100 K cold temperature.
%--------------------------------------------------------------------------
% See also: Cryocooler, Plot2D
%--------------------------------------------------------------------------

%--------------------------------------------------------------------------
%   Copyright (c) 2018 Princeton Satellite Systems, Inc.
%   All rights reserved.
%--------------------------------------------------------------------------


tC  = linspace(50,100);  % K
qC  = [1 10 100];      % W
n   = length(qC);
m   = zeros(n,length(tC));
eff = m;
Pin = m;
l   = cell(3,1);
for k = 1:n
  [m(k,:), eff(k,:),cOP] = Cryocooler( qC(k), tC );
  Pin(k,:) = qC(k)./cOP;
  l{k} = sprintf('%4.1f W',qC(k));
end

Plot2D(tC,m,'t_c (K)','Mass (kg)','Cryocooler Mass','ylog');
legend(l)
Plot2D(tC,eff(1,:),'t_c (K)','Efficiency','Efficiency (% Carnot)');
Plot2D(tC,Pin,'t_c (K)','Power (Pin)','Input Power','ylog');
legend(l)

if 0
  PrintFig(1,4,1,'CryoMass');
  PrintFig(1,4,2,'CryoEff');
end


%--------------------------------------