Coil with cryocooler mass analysis
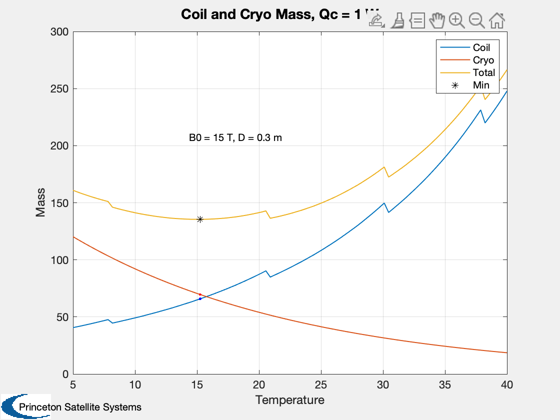
Calculate the coil and cryocooler mass for a magnet with a specific inner radius and target central field, as a function of operating temperature. This is also dependent on the amount of heat the cryocooler is removing, which is an input.
%--------------------------------------------------------------------------
% See also: PancakeMagnetMass, CryocoolerBrake
%--------------------------------------------------------------------------

%--------------------------------------------------------------------------
% Copyright Princeton Satellite Systems, 2019. All rights reserved.
% STTR NNX17CC74P
%--------------------------------------------------------------------------

% Optimal mass for a single high-temperature superconducting coil
% mirror coil: 15-20 T, inner radius 0.15 m
% axial coil: 5-7 T, inner radius 0.5 m

B0 = 15;    % T
Ri = 0.15;  % m
qC = 1;     % W; a guess

d = SuperconductorDataStructure;

Ts = linspace(5,40);
Zs = zeros(size(Ts));
Ns       = Zs;
massCoil = Zs;
massCryo = Zs;
Iop      = Zs;
for k = 1:length(Ts)
  Ic = SuperPowerHTS( B0, Ts(k) );
  Iop(k) = 0.6*Ic;
  N = 1;
  width = 0;
  height = 1;
  while width<height
    [massCoil(k),turns,height,width] = PancakeMagnetMass( B0, Ri, N, Iop(k), d );
    N = N+1;
  end
  Ns(k) = N;
  massCryo(k) = CryocoolerBrake( qC, Ts(k) );
end
mass = massCoil + massCryo;

% an estimate of the structural mass (energy method), carbon fiber structure
rhoM   = 2500;    % Density (kg/m^3)
sigmaM = 1000e6; % Ultimate stress (N/m^2)
volume = 4/3*pi*Ri^3;
massStruct = MagnetMassVirial( rhoM, sigmaM, B0, volume );

tStr = sprintf('Coil and Cryo Mass, Qc = %g W',qC);
Plot2D(Ts,[massCoil;massCryo;mass],'Temperature','Mass',tStr)

[~,kMin] = min(mass);
hold on;
plot(Ts(kMin),mass(kMin),'k*')
plot(Ts(kMin),massCoil(kMin),'b.')
plot(Ts(kMin),massCryo(kMin),'r.')

legend('Coil','Cryo','Total','Min')

disp('Use mouse to place text on plot')
gtext(sprintf('B0 = %g T, D = %g m',B0,2*Ri));


%--------------------------------------
Use mouse to place text on plot