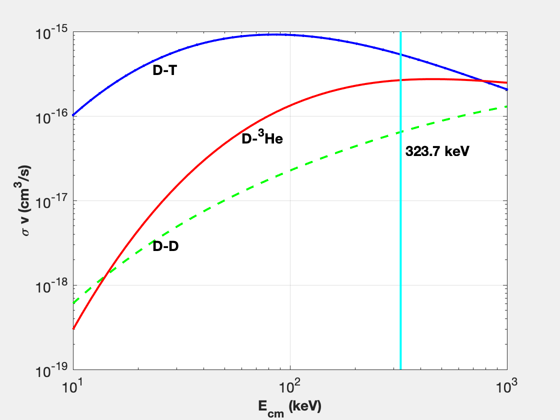
Plot collision crosssections for D-D, D-T and D-He3 reactions.
Shows the temperature for maximum difference between D-D and D-He3 crosssections.
This demo uses custom plotting to make the plots look nicer for publication.
%--------------------------------------------------------------------------
%   Copyright (c) 2016 Princeton Satellite Systems, Inc.
%   All rights reserved.
%--------------------------------------------------------------------------
%   Since 2016.1
%--------------------------------------------------------------------------

r1 = {'D' 'D' 'D'};
r2 = {'T' 'D' 'He3'};
tK = logspace(1,3);
s  = SigmaV( r1, r2, tK )*1e6;

h = NewFig('Crosssection');
loglog(tK,s(1,:),'b.-','LineWidth',2)
hold on
loglog(tK,s(2,:),'g--','LineWidth',2)
loglog(tK,s(3,:),'r','LineWidth',2);
grid
YLabelS('\sigma v (cm^3/s)')
XLabelS('E_{cm} (keV)')

text(tK(10), 0.8*s(1,10),'D-T');
text(tK(10), 0.9*s(2,10),'D-D');
text(tK(20), 0.9*s(3,20),'D-^3He');

[dS,kMax]   = max(s(3,:) - s(2,:));
yLim        = get(gca,'ylim');
line([tK(kMax) tK(kMax)], yLim,'color','c','LineWidth',2);
text(1.05*tK(kMax), 0.6*s(2,kMax),sprintf('%4.1f keV',tK(kMax)));

set(gca,'YMinorGrid','off');
set(gca,'XMinorGrid','off');

set(gca,'FontSize',14)

set(findall(h,'type','text'),'fontSize',14,...
    'fontWeight','bold','FontName','helvetica')


%------------------------------------------------------