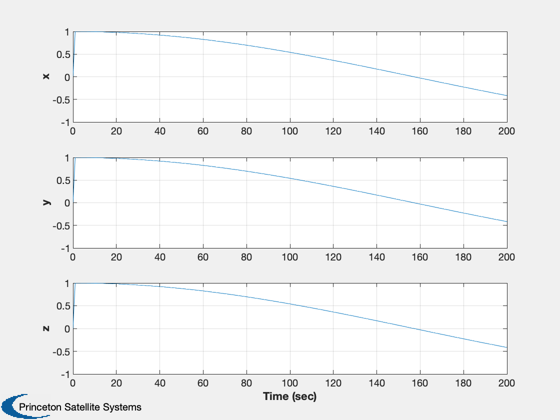
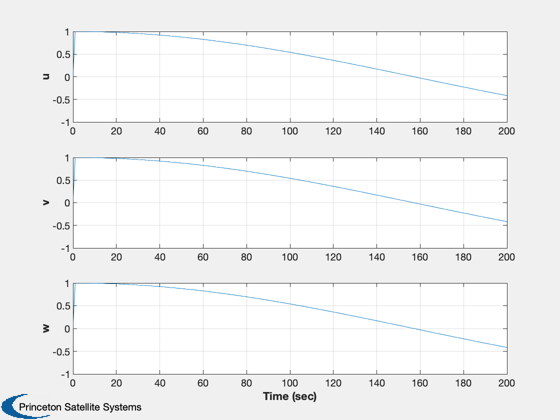
Demonstrate real-time plots
------------------------------------------------------------------------
See also RealTimePlot
------------------------------------------------------------------------
%-------------------------------------------------------------------------------
%   Copyright 1998 Princeton Satellite Systems, Inc. All rights reserved.
%-------------------------------------------------------------------------------


g = [];

g.title  = {'Position' 'Velocity'};
g.yLabel = {'x' 'y' 'z' 'u' 'v' 'w'};
g.tLabel = 'Time (sec)';
g.page   = {[1 2 3] [4 5 6]};
g.tLim   = [0 100];
g        = RealTimePlot( 'initialize', [], [], g );

for k = 1:200
  y = cos((k/100)*ones(6,1));
  g = RealTimePlot( 'update', y, k, g );
end


%--------------------------------------
% PSS internal file version information
%--------------------------------------
% $Date$
% $Id: 328b338fcd30906dd9a558a36b66e61d24cb8d45 $