Simple Continuous Stirred Tank Reactor Simulation
Simulates a simple model of a continuous stirred tank reactors (CSTR) in series.
Since version 1.
-------------------------------------------------------------------------
Reference: Henson, M. A. and D. E. Seborg. (1997.) Nonlinear Process
           Control, Prentice-Hall. pp. 198-199.
-------------------------------------------------------------------------
See also:    RHSCSTR, TimeGUI, Plot2D
-------------------------------------------------------------------------
Contents
%--------------------------------------------------------------------------
%   Copyright (c) 2001 Princeton Satellite Systems, Inc.
%   All rights reserved.
%--------------------------------------------------------------------------
Model parameters
F = feed stream, C = coolant stream, 1 = 1st reactor, 2 = 2nd reactor ------------------------------------
d.q    = 100; % Flow rate (L/min)
d.qC   = 100; % Coolant flow rate (control)
d.cAF  = 1; % Concentration of the feed (mol/L)
d.tF   = 350; % Temperature of feed stream (deg-K)
d.tCF  = 350; % Temperature of coolant stream (deg-K)
d.v1   = 100; % Volume tank 1 (L)
d.v2   = 100; % Volume tank 2 (L)
d.k0   = 7.2e10; % 1/min
d.eOR  = 1e4; % E/R (deg-K)
d.nDH  = 4.78e-4; % Negative change in enthalpy (J/mol)
d.rho  = 1000; % Density (g/L)
d.rhoC = 1000; % Density of coolant (g/L)
d.cP   = 0.239; % Specific heat constant pressure (J/g-K)
d.cPC  = 0.239; % Specific heat constant pressure of coolant (J/g-K);
d.hA1  = 1.67e5; % J/min-K
d.hA2  = 1.67e5; % J/min-K

cA1    = 5e-3;
t1     = 250;
State [cA1;t1;cA2;t2]
----------------------
x           = [cA1;t1;cA1;t1];
t           = 0;
The control sampling period and the simulation integration time step
---------------------------------------------------------------------
dT = 1;
Number of sim steps
--------------------
nSim        = 100;
tEnd        = nSim*dT;
Plotting arrays
----------------
tPlot      = zeros(1,nSim);
xPlot      = zeros(4,nSim);
Run the simulation
See RHSCSTR.m which gives a model of continuously-stirred tank reactors in series. -------------------------------------------------------------------------
for k = 1:nSim
  x           = RK4( 'RHSCSTR', x, dT, t, d );
  t           = t + dT;
  tPlot(k)    = t;
  xPlot(:,k)  = x;
end
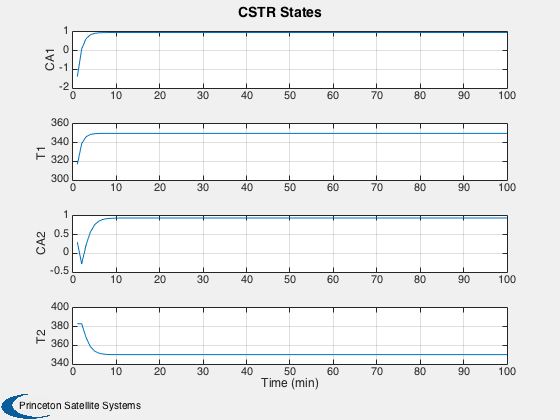
Plot results
Open loop response is shown. ----------------------------
Plot2D( tPlot, xPlot,'Time (min)',['CA1';'T1 ';'CA2';'T2 '], 'CSTR States')

%--------------------------------------
% PSS internal file version information
%--------------------------------------