Continuous Fermenter Control
Simulates a model of a continuous fermenter. Constant volume reactor where single, rate limiting substrate yields biomass growth and product formation.
Since version 1.
-------------------------------------------------------------------------
Reference: Henson, M. A. and D. E. Seborg. (1997.) Nonlinear
           Process Control, Prentice-Hall. pp. 203-204.
-------------------------------------------------------------------------
See also:    RHSFermenter, MuFermenter, TimeGUI, Plot2D
-------------------------------------------------------------------------
Contents
%--------------------------------------------------------------------------
%   Copyright (c) 2013 Princeton Satellite Systems, Inc.
%   All rights reserved.
%--------------------------------------------------------------------------
Model parameters
-----------------
d.yXS   = 0.4;      % Cell-mass yield parameter (g/g)
d.beta  = 0.2;      % Yeild parameter (1/hr)
d.pM    = 50;       % Constant parameter (g/L)
d.kI    = 22;       % Constant parameter (g/L)
d.d     = 0.202;    % Dilution rate (1/hr)
d.alpha = 2.2;      % Yield parameter (g/g)
d.muM   = 0.48;     % Maximum specific growth rate (1/hr)
d.kM    = 1.2;      % Constant parameter (g/L)
d.sF    = 20;       % Feed substrate concentration (g/L)
State
[X;S;P] X = biomass concentration S = substrate concentration P = product concentration ---------------------------
x           = [6;5;19.14];
t           = 0;
The control sampling period and the simulation integration time step
---------------------------------------------------------------------
dT = 1;
Number of sim steps
--------------------
nSim        = 100;
tEnd        = nSim*dT;
Plotting arrays
----------------
tPlot      = zeros(1,nSim);
xPlot      = zeros(3,nSim);
Run the simulation
See RHSFermenter.m which gives a model of a constant volume reactor in which a single, rate limiting substrate promotes biomass growth and product formation. -------------------------------------------------------------------------
for k = 1:nSim
  x           = RK4( 'RHSFermenter', x, dT, t, d );
  t           = t + dT;
  tPlot(k)    = t;
  xPlot(:,k)  = x;
end
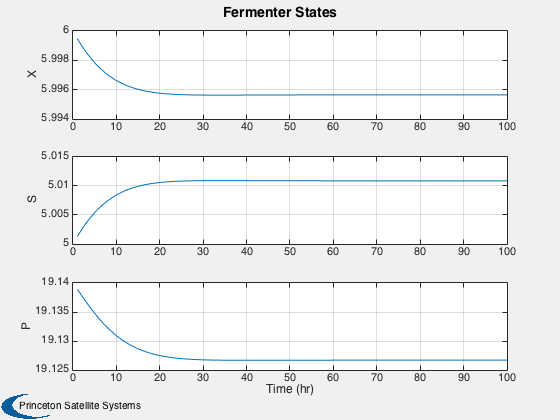
Plot Results
Open loop response is given. ----------------------------
Plot2D( tPlot, xPlot,'Time (hr)',['X';'S';'P'],'Fermenter States')

%--------------------------------------
% PSS internal file version information
%--------------------------------------