Fluidized Bed Simulation
Simulates a fluidized bed reactor - demonstrates model predictive control
Since version 1.
-------------------------------------------------------------------------
Reference: Henson, M. A. and D. E. Seborg. (1997.) Nonlinear Process
           Control, Prentice-Hall. p. 244.
-------------------------------------------------------------------------
See also:    RHSFluidizedBed, TimeGUI, Plot2D
-------------------------------------------------------------------------
Contents
%--------------------------------------------------------------------------
%   Copyright (c) 2013 Princeton Satellite Systems, Inc.
%   All rights reserved.
%--------------------------------------------------------------------------
Model parameters
-----------------
d.lEA     = 1.0;  % Lewis number
d.lEB     = 1.0;  % Lewis number
d.betaHat = 1.0;  % Residence time
d.beta1   = 0.25; % Heat of reaction
d.beta2   = 0.25; % Heat of reaction
d.gamma1  = 1.0;  % Activation energy
d.gamma2  = 1.0;  % Activation energy
d.alpha1  = 1.0;  % Rate constant factor
d.alpha2  = 1.0;  % Rate constant factor
d.xAF     = 0.5;  % Concentration of A in the feed stream
d.xBF     = 0.5;  % Concentration of B in the feed stream
d.tF      = 300;  % Temperature in feed stream
d.u       =   0;  % Control
State
[concentration of A; concentration of B; temperature]
%---------------------
x           = [1;1;300];
t           = 0;
The control sampling period and the simulation integration time step
---------------------------------------------------------------------
dT = 1;
Number of sim steps
--------------------
nSim        = 100;
tEnd        = nSim*dT;
Plotting arrays
----------------
tPlot      = zeros(1,nSim);
xPlot      = zeros(3,nSim);
Run the simulation
See RHSFluidizedBed.m which gives a model of a fluidized bed. -------------------------------------------------------------
for k = 1:nSim
  x           = RK4( 'RHSFluidizedBed', x, dT, t, d );
  t           = t + dT;
  tPlot(k)    = t;
  xPlot(:,k)  = x;
end
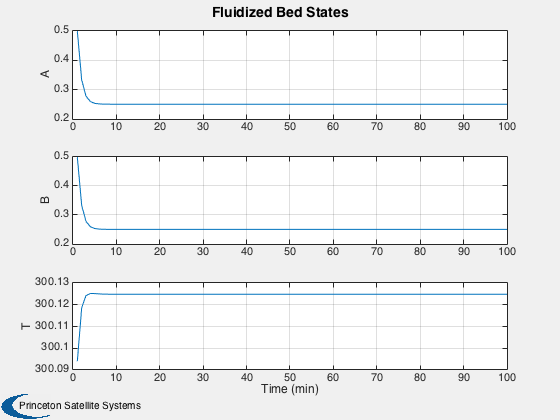
Plot results
Open loop response is shown below. ----------------------------------
j     = 1:k;
Plot2D( tPlot, xPlot,'Time (min)',['A';'B';'T'], 'Fluidized Bed States')

%--------------------------------------
% PSS internal file version information
%--------------------------------------