A reentry simulation with lift and drag forces. Uses LiftingReentry3D.m
The vehicle starts at 380 km, the ISS altitude. It does a delta-v to do a Hohmann transfer to 40 km where drag causes reentry. You can control reentry using angle of attack (d.alpha). ------------------------------------------------------------------------ See also Plot2D, TimeLabl, Dot, Mag, RK4, Unit, DVHoh, RHSLiftingReentry3D ------------------------------------------------------------------------
Contents
%--------------------------------------------------------------------------
%    Copyright (c) 2009 Princeton Satellite Systems, Inc.
%    All Rights Reserved.
%--------------------------------------------------------------------------

% The maximum number of integration time steps
nSim           = 4800;

% The time increment
dT             = 1; % s

% Setup the data structure
d              = RHSLiftingReentry3D;

% Adjust parameters in the data structure
d.sRef         = 20; % m^2
d.mass         = 100; % kg

% Initial conditions
r0             = d.rPlanet + 380;
r              = [r0;0;0];
rI             = d.rPlanet +  40;
Hohmann transfer to 70 km
[dV, dV1, dVI] = DVHoh( rI, r0, sqrt(d.mu/rI) );
v              = [0;sqrt(d.mu/r0) - dVI;0];
x0             = [r;v]; % Last number is mass of fuel
Run the sim
% Store plot points in x and f
x = [x0 zeros(length(x0),nSim)];
f = [LiftAndDragSeaLevelToOrbit(x0,d)/d.mass zeros(3,nSim)];

% This displays a GUI to show you how much time is left in the sim
TimeDisplay( 'initialize', 'Reentry Simulation', nSim )

for k = 1:nSim

  % Update the display
	TimeDisplay( 'update' )

  % Propagate the state
  x(:,k+1) = RK4( @RHSLiftingReentry3D, x(:,k), dT, 0, d );

  % Get the forces for plotting
  f(:,k+1) = LiftAndDragSeaLevelToOrbit(x(:,k),d)/d.mass;

  % Check for landing
  if( Mag(x(1:3,k+1)) - d.rPlanet <= eps )
    break;
  end

end

% Close the display
TimeDisplay( 'close' )

% Adjust the size of the arrays in case we land sooner than nSim
x    = x(:,1:(k+1));
f    = f(:,1:(k+1));
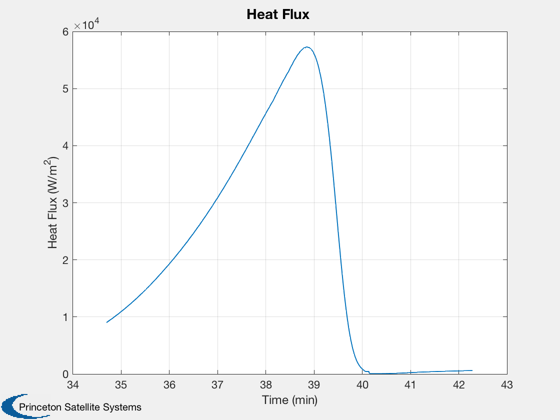
Calculate the heating rate history
q.time      = (0:k)*dT;
q.velocity  = Mag(x(4:6,:))*1000;
q.aoa       = d.alpha;
q.altitude  = (Mag(x(1:3,:)) - d.rPlanet)*1000;
k2          = find(q.altitude < 80000,1);
q.time      = q.time(k2:end);
q.velocity  = q.velocity(k2:end);
q.altitude  = q.altitude (k2:end);
qDot        = AeroHeatFlux( q, d.l, 'laminar plate' );
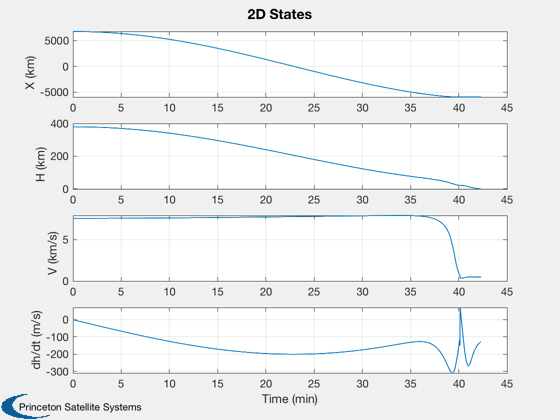
Plot the states
% Create the time array and label
[t, tL] = TimeLabl( (0:k)*dT );

yL = {'X (km)' 'H (km)' 'V (km/s)' 'dh/dt (m/s)'};
dhdt = Dot(Unit(x(1:3,:)),x(4:6,:))*1000;

h = Mag(x(1:3,:)) - d.rPlanet;
Plot2D( t, [x(1,:);h;Mag(x(4:6,:));dhdt], tL, yL, '2D States');
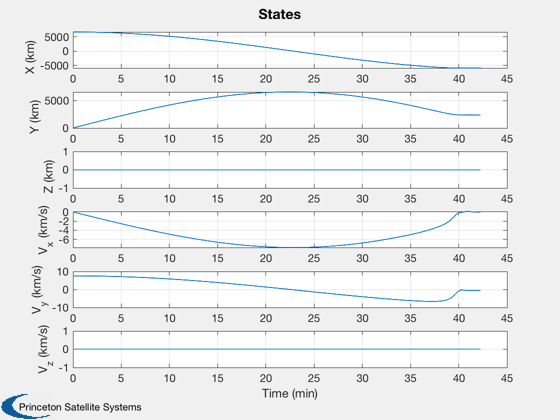
yL = {'X (km)' 'Y (km)' 'Z (km)' 'V_x (km/s)' 'V_y (km/s)' 'V_z (km/s)'};
Plot2D( t, x(1:6,:), tL, yL, 'States');

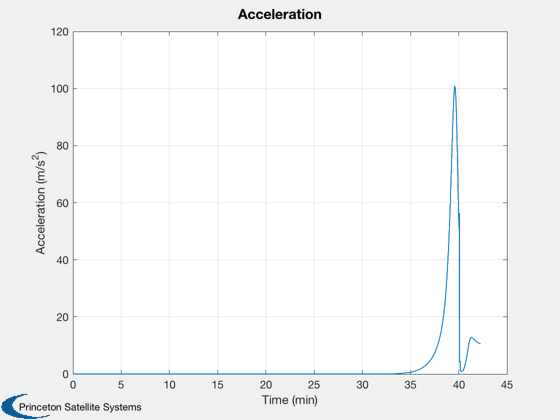
yL = {'Acceleration (m/s^2)'};
Plot2D( t, Mag(f), tL, yL, 'Acceleration');
Plot the heat flux
[t, tL] = TimeLabl( q.time );
yL = {'Heat Flux (W/m^2)'};
Plot2D( t, qDot, tL, yL, 'Heat Flux ' );

Figui;

%--------------------------------------
