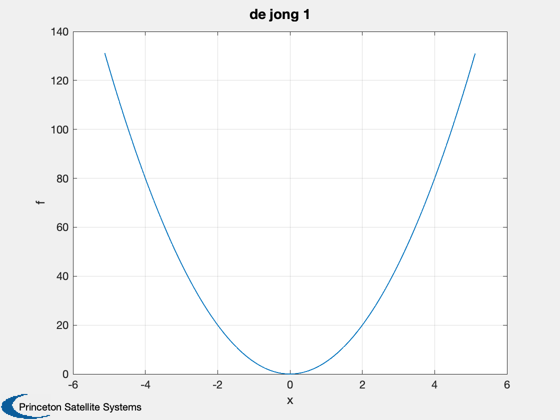
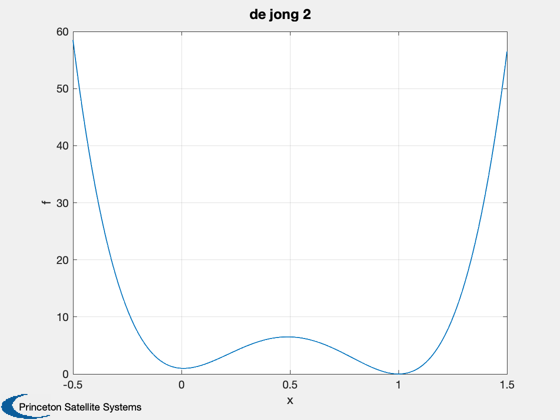
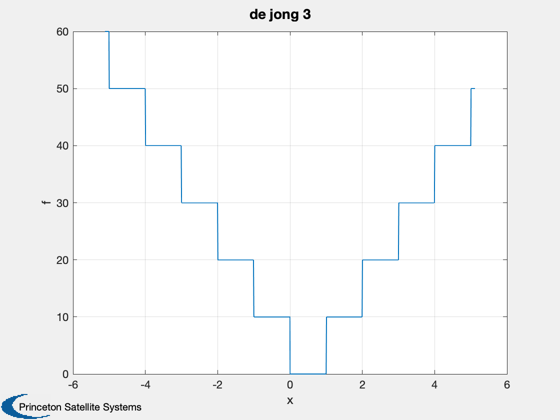
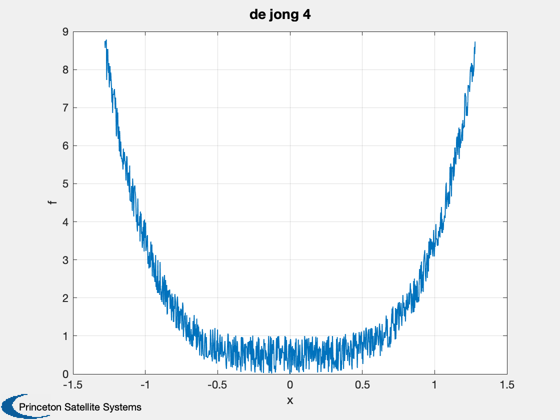
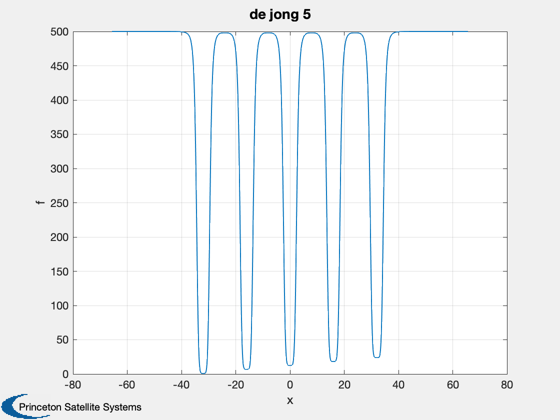
Plot the 5 De Jong functions.
Since version 7.
--------------------------------------------------------------------------
Copyright (c) 2005 Princeton Satellite Systems, Inc.
All Rights Reserved
------------------------------------------------------------------------
See also Plot2D, OptTestFun
------------------------------------------------------------------------
xLimMin = [5.12 0.5 5.12 1.28 65.536];
xLimMax = [5.12 1.5 5.12 1.28 65.536];
n = [5 2 10 2 10];
m = 1000;
f = zeros(1,m);
for j = 1:5
d.n = n(j);
d.name = ['de jong ' num2str(j)];
x = linspace(-xLimMin(j),xLimMax(j),m);
for k = 1:m
f(k) = OptTestFun( x(k)*ones(n(j),1), d );
end
Plot2D( x, f, 'x', 'f', d.name);
end