Demonstrate JPL ephemeris for the solar system.
There are two functions, SolarSysJPL for inputing a time vector and PlanetPosJPL for getting the state at a specific time.
------------------------------------------------------------------------
See also SolarSysJPL, PlanetPosJPL, NewFig, TextS, Date2JD,
JDToDateString, InterpolateState
------------------------------------------------------------------------
Contents
%--------------------------------------------------------------------------
%	  Copyright (c) 2007,2019 Princeton Satellite Systems, Inc.
%   All rights reserved.
%--------------------------------------------------------------------------
%   Since version 7.
%   2019.1 Fixed SolarSysJPL demo and generated more points for th emoon
%--------------------------------------------------------------------------

id = [1 2 3 4 5 10];
jD0 = Date2JD;
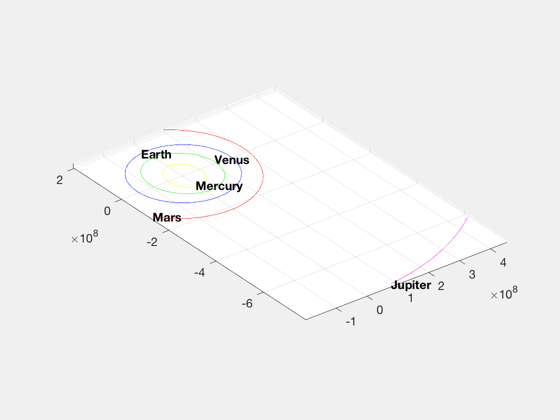
Demonstrate SolarSysJPL: planet positions over a time period
%-------------------------------------------------------------
tPlot = jD0+linspace(0,365,1000);
InterpolateState([],[],'bin2000.405');
PlanetPosJPL( 'initialize', id );
[xP, yP, zP] = SolarSysJPL( id, tPlot, 1 );

NewFig('Planets Trajectory');
s = JDToDateString( jD0 );
title(s)
plot3(xP(1,:)',yP(1,:)',zP(1,:)','y',...
      xP(2,:)',yP(2,:)',zP(2,:)','g',...
      xP(3,:)',yP(3,:)',zP(3,:)','b',...
      xP(4,:)',yP(4,:)',zP(4,:)','r',...
      xP(5,:)',yP(5,:)',zP(5,:)','m')
TextS(xP(1:5,1)',yP(1:5,1)',char({'Mercury','Venus','Earth','Mars','Jupiter'}))
grid on; axis equal;
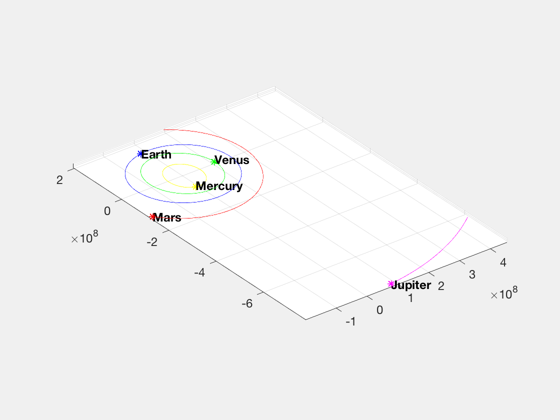
Demonstrate PlanetPosJPL: planet positions at a specific time
%--------------------------------------------------------------
rP  = PlanetPosJPL( 'update', jD0, 1 );
hold on
plot3(rP(1,1),rP(2,1),rP(3,1),'y*',...
      rP(1,2),rP(2,2),rP(3,2),'g*',...
      rP(1,3),rP(2,3),rP(3,3),'b*',...
      rP(1,4),rP(2,4),rP(3,4),'r*',...
      rP(1,5),rP(2,5),rP(3,5),'m*')
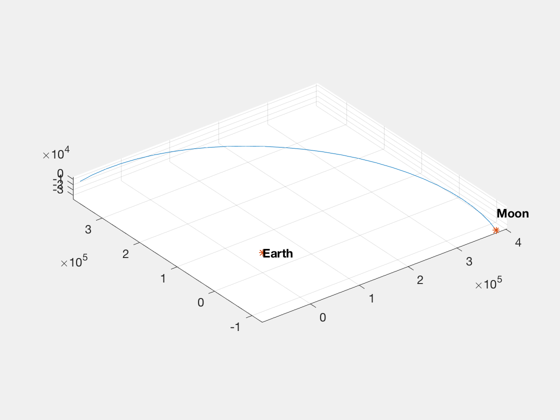
Plot the moon separately (geocentric)
%--------------------------------------
NewFig('Geocentric Moon Trajectory');
plot3(xP(end,1:28)',yP(end,1:28)',zP(end,1:28)')
grid on; axis equal;
hold on
plot3([rP(1,6) 0],[rP(2,6) 0],[rP(3,6) 0],'*')
TextS([rP(1,6) 0],[rP(2,6) 0],char({'Moon','Earth'}))
grid on; axis equal;


%--------------------------------------