Contents
Test a star sensor attitude determination system.
This system does not use gyros. dT is the time step for the attitude determination system. You can numerically integrate with a smaller time step by setting nInt > 1.
See also AttDetNoGyros, StarSensor, QMult, QPose, QUnit, Plot2D, RK4,
RandSC
%--------------------------------------------------------------------------
%--------------------------------------------------------------------------
%   Copyright 1998, 2017 Princeton Satellite Systems, Inc.
%   All rights reserved.
%--------------------------------------------------------------------------
%   Since version 3.
%   2017.1 Made compatible with StarIDPyramid.
%--------------------------------------------------------------------------
Setup
rng(0);

% Constants
degToRad = pi/180;

% Simulation data
nInt     = 2;

% Spacecraft data
inr      = [1000 0 0;0 2000 0; 0 0 2000];
invInr   = inv(inr);
torque   = zeros(3,1);

% Gyro data
uRIG    = eye(3);

% User inputs
fOV     	            = 30*degToRad;
fScale   	            = 1;
nStars   	            = 1000;
qBToS                 = [cos(pi/4); 0; sin(pi/4); 0];
uS                    = [0 0 1]';
nPixels               = 1024;
angRes                = 5*fOV/nPixels;
options               = StarIDPyramid;
options.pixelMapScale = fScale;
Initialization
Initial state
q0      = [1;0;0;0];
wo      = 0.01;
bias    = [0;0;0];
omega   = [wo;0;0];
intRate = [0;0;0];
x       = [q0;omega;intRate;bias]; % True state

% Gyro information
nRWRIG  = zeros(3,1);
nBRIG   = zeros(3,1);
nORIG   = zeros(3,1);
betaRIG = zeros(3,1);

% Simulation information
nSim    = 20;
dT      = 0.5;

% Set up arrays
xPlot     = zeros(13,nSim);
qErrPlot	= zeros( 4,nSim);
wPlot     = zeros( 3,nSim);
tPlot     = zeros( 1,nSim);
qEPlot    = zeros( 4,nSim);
sDPlot    = zeros( 1,nSim);

% Estimation initialization
p         = diag([0.01 0.01 0.01]);   % State covariance
Q         = eye(3);   % Plant noise covariance
r         = 0.0001;   % Star centroid covariance
q         = QUnit([1;0.1;0.4;0.2]); % Initial estimate


% Create a random star catalog
[starMatrix,starCatalog]	= RandSC(nStars,2);
dStarData                 = StarDataGeneration( starCatalog, fOV*sqrt(2), angRes );
starData                  = struct('starMatrix',dStarData.starMatrix,'starID',[],'uMeas',[],'uCatalog',[]);
options                   = StarIDPyramid;
options.pixelMapScale     = fScale;
StarDataGeneration: Eliminating stars that cannot be separated based on the input angular resolution.

StarDataGeneration:     2 stars will be eliminated that are too close to other stars.
                      998 stars will be in the reduced catalog.
Run the simulation
t               = 0;
qOld            = q;
dTSim           = dT/nInt;
for i = 1:nSim

  % Attitude Determination
  starSensorData  =  StarSensor( x(1:4), qBToS, uS, dStarData.starMatrix, fOV, fScale );

  % Star identification
  if( ~isempty(starSensorData) )
    starMeas.pixelIntensity = starSensorData(1,:);
    starMeas.pixelLocation  = starSensorData(2:3,:);
    [starData.starID,starData.uMeas,starData.uCatalog]	= StarIDPyramid( starMeas, dStarData, options );
  else
    starData.starID   = [];
    starData.uMeas    = [];
    starData.uCatalog	= [];
  end

	[q, p, qOld, omega]	= StellarAttDetEKFNoGyros( q, qOld, omega, dT, p, Q, r, qBToS, starSensorData, starData, fScale );

  % Plotting
	qErrPlot(:,i)   = QMult(QPose(q),x(1:4));
  wPlot(:,i)      = omega;
  xPlot(:,i)    	= x;
  tPlot(i)        = t;
  qEPlot(:,i)     = q;
	sDPlot(:,i)     = length(starData.starID);

  % Simulation
  for k = 1:nInt
    x      = RK4( @FRBwRIG, x, dTSim, t, inr, invInr, torque, uRIG, nRWRIG, nBRIG, betaRIG );
    t      = t + dTSim;
  end

end
StarMeas: Acquiring
Plot results
[t, tL]  = TimeLabl(tPlot);
yL1     = 'Quaternion Error';
yL2     = {'True' 'Estimated'};
yL3     = {'Q Error' '# Stars'};

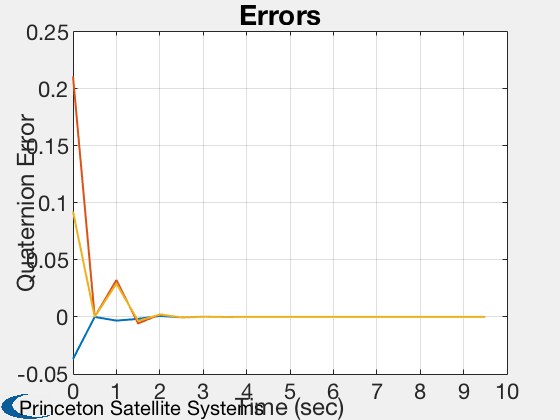
Plot2D( t, qErrPlot(2:4,:),         tL, yL1,  'Errors')
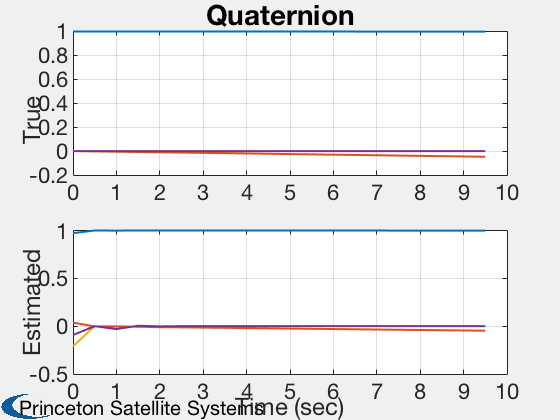
Plot2D( t, [xPlot(1:4,:); qEPlot],  tL, yL2,  'Quaternion',       'lin',  {'1:4' '5:8'})
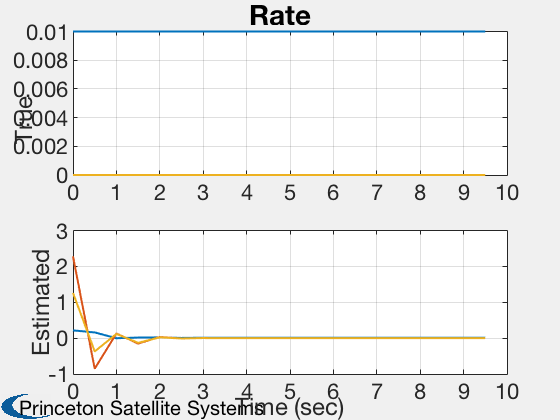
Plot2D( t, [xPlot(5:7,:); wPlot],   tL, yL2,  'Rate',             'lin',  {'1:3' '4:6'})
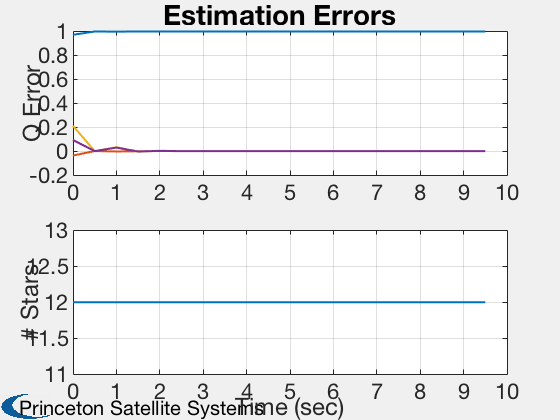
Plot2D( t, [qErrPlot;sDPlot],       tL, yL3,  'Estimation Errors','lin',  {'1:4' '5'})


%--------------------------------------


