Test a star sensor attitude determination system with gyros.
dT is the time step for the attitude determination system. You can numerically integrate with a smaller time step by setting nInt > 1.
------------------------------------------------------------------------- See also StellarAttDetEKF, StarDataGeneration, StarSensor and RandSC -------------------------------------------------------------------------
Contents
%--------------------------------------------------------------------------
%   Copyright (c) 2016 Princeton Satellite Systems, Inc.
%   All rights reserved.
%--------------------------------------------------------------------------
%   Since version 2017.1
%   Version 2018.1 Added RIG noise to the simulation.
%--------------------------------------------------------------------------
Always have the same random numbers
Comment this out to test with different numbers each run
rng(0);

% Constants
degToRad	            = pi/180;

% User inputs
fOV     	            = 30*degToRad;
fScale   	            = 1;
nStars   	            = 1000;
rIGNoise1Sigma        = 0.001; % rad
qBToS                 = [cos(pi/4); 0; sin(pi/4); 0];
uS                    = [0 0 1]';
nPixels               = 1024;
angRes                = 5*fOV/nPixels;
options               = StarIDPyramid;
options.pixelMapScale = fScale;
nInt                  = 2;    % The number of integration steps per estimation step
inr                   = [1000 0 0;0 2000 0; 0 0 2000];
invInr                = inv(inr);
torque                = zeros(3,1);
uRIG                  = eye(3); % Rate integrating gyro vectors
nSim                  = 100;
dT                    = 0.5; % Time step (sec)

% Attitude determination system initialization
b                     = zeros(3,1);   % Initial bias estimate
p                     = diag([0.01 0.01 0.01 0.001 0.001 0.001]);       % Covariance matrix
Q                     = 0.01*eye(6);       % Plant noise matrix
r                     = 0.0001;       % Noise for a star measurement
q                     = QUnit([1;0.1;0.2;0.2]); % Initial estimate
Initial state
q0      = [1;0;0;0];
bias    = [0.01; 0.03; -0.04];
wo      = 0; % 0.01
omega   = [wo;0;0];
intRate = dT*(omega + bias);
x       = [q0;omega;intRate;bias]; % True state
nRWRIG	= zeros(3,1);
nBRIG   = zeros(3,1);
nORIG   = zeros(3,1);
betaRIG = zeros(3,1);
xRIGOld	= zeros(3,1);

% Set up the simulation
t       = 0;
x(1:4)  = QUnit(x(1:4));

% Set up arrays for plotting
angInc    = zeros(3,1);
xPlot     = zeros(13,nSim);
qPlot     = zeros( 4,nSim);
bPlot     = zeros( 3,nSim);
aPlot     = zeros( 3,nSim);
tPlot     = zeros( 1,nSim);
qEPlot    = zeros( 4,nSim);
sDPlot    = zeros( 1,nSim);
qErrPlot	= zeros( 4,nSim);

% Create a random star catalog
[starMatrix,starCatalog]	= RandSC(nStars,2);
dStarData                 = StarDataGeneration( starCatalog, fOV*sqrt(2), angRes );
starData                  = struct('starMatrix',dStarData.starMatrix,'starID',[],'uMeas',[],'uCatalog',[]);
StarDataGeneration: Eliminating stars that cannot be separated based on the input angular resolution.

StarDataGeneration:     2 stars will be eliminated that are too close to other stars.
                      998 stars will be in the reduced catalog.
Run the simulation
dTInt = dT/nInt;
for i = 1:nSim

  % Attitude Determination
  starSensorData    = StarSensor( x(1:4), qBToS, uS, starMatrix, fOV, fScale );
  [angInc, xRIGOld] = RIGOut( x(8:10), xRIGOld, nORIG );

  angInc = angInc + rIGNoise1Sigma*randn(3,1);

  % Star identification
  if( ~isempty(starSensorData) )
    starMeas.pixelIntensity = starSensorData(1,:);
    starMeas.pixelLocation  = starSensorData(2:3,:);
    [starData.starID,starData.uMeas,starData.uCatalog]	= StarIDPyramid( starMeas, dStarData, options );
  else
    starData.starID   = [];
    starData.uMeas    = [];
    starData.uCatalog	= [];
  end

  % Plotting
  bPlot(:,i)    = b;
  xPlot(:,i)    = x;
  aPlot(:,i)    = angInc;
  tPlot(i)      = t;
  qEPlot(:,i)   = q;
	sDPlot(:,i)   = length(starData.starID);
	qErrPlot(:,i)	= QMult(QPose(q),x(1:4));

  % The extended Kalman Filter
	[q, b, p] = StellarAttDetEKF(angInc,q,dT,b,p,Q,r,qBToS,starSensorData,starData,fScale);

  % Simulation
  for k = 1:nInt
    x      = RK4( @FRBwRIG, x, dTInt, t, inr, invInr, torque, uRIG, nRWRIG, nBRIG, betaRIG );
    t      = t + dTInt;
  end

end
Plot results
[tPlot, tLbl] = TimeLabl(tPlot);

yLbl = {'True'  'Estimated'};
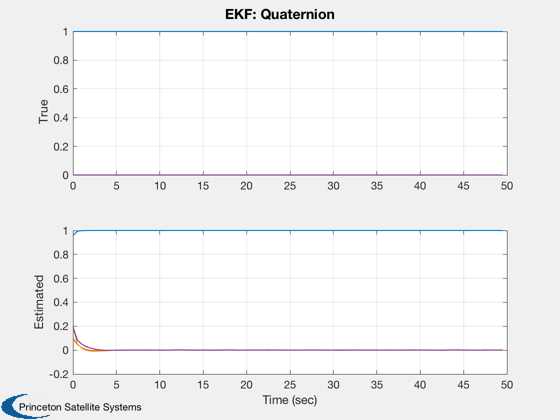
Plot2D( tPlot, [xPlot(1:4,:);qEPlot],tLbl,yLbl,'EKF: Quaternion', 'lin',{'1:4' '5:8'})

yLbl = {'x (rad/s)' 'y (rad/s)' 'z (rad/s)'};
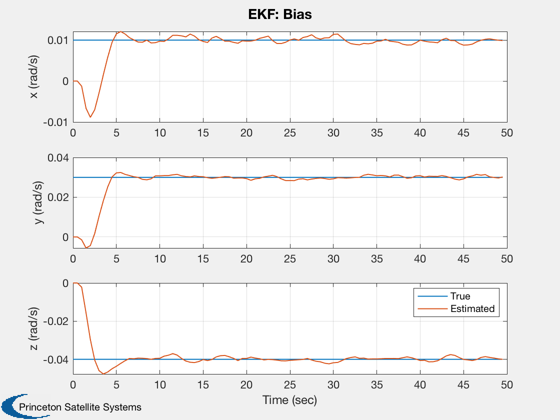
Plot2D( tPlot, [xPlot(11:13,:);bPlot],tLbl,yLbl,'EKF: Bias','lin', {'[1 4]' '[2 5]' '[3 6]'})
legend('True', 'Estimated')

yLbl = {'Rates' 'Integrated Rates' 'Biases' 'Ang Increments'};
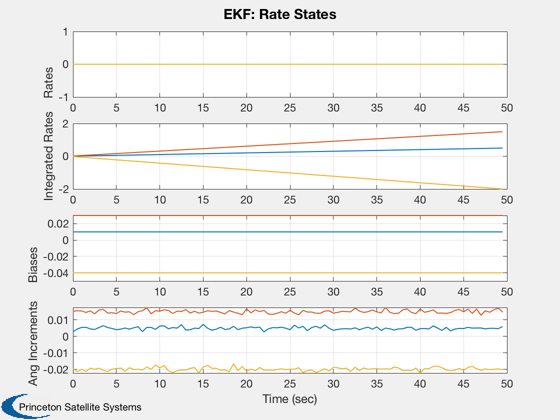
Plot2D( tPlot, [xPlot(5:13,:);aPlot],tLbl,yLbl,'EKF: Rate States', 'lin',{'1:3' '4:6' '7:9' '10:12'})

yLbl = {'Bias Error' 'Q Error' '# Stars'};
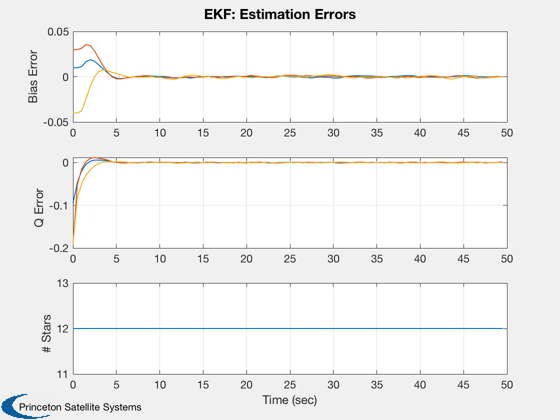
Plot2D( tPlot, [xPlot(11:13,:)-bPlot;qErrPlot;sDPlot],tLbl,yLbl,'EKF: Estimation Errors','lin',{'1:3' '5:7' '8'})

%--------------------------------------


