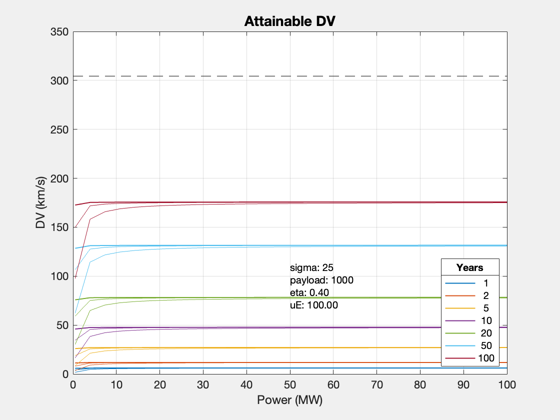
Demo of attainable DV for a given payload mass
Plot curves approaching the theoretical maximum delta-V.
See also: DVConstantThrust
%--------------------------------------------------------------------------
%	Copyright (c) 2005 Princeton Satellite Systems, Inc.  All rights reserved.
%--------------------------------------------------------------------------

% Constants
year = 365.25*86400;    % s

% Power limit: 0.5 to 1000 MW
Pmin = 0.5e6;
Pmax = 100e6;
powers = linspace(Pmin,Pmax,30);

% Mission parameters
payload  = 1000;   % kg

% Main engine parameters
uExhaust = 100;     % km/s
sigma    = 25;    % W/kg
eta      = 0.4;    % fusion power to thrust

% Fuel structural ratio
sR       = 0.05;

nYears = [1 2 5 10 20 50 100];

DV = [];
massFrac = [];
for j = 1:length(nYears)
  duration = nYears(j)*year;
  for k = 1:length(powers)
    thrust = 2*powers(k)*eta/(uExhaust*1e3);
    mFuel = thrust/(uExhaust*1e3)*duration;
    mEngine = powers(k)/sigma;
    DV(j,k) = DVConstantThrust( thrust, payload+mEngine+sR*mFuel, mFuel, uExhaust, duration );
  end
end
[hs,ls] = Plot2D(powers/1e6,DV/1e3,'Power (MW)','DV (km/s)','Attainable DV')
yy = axis;
yX = mean(yy(1:2));
yY = mean(yy(3:4));
text(yX,yY,{sprintf('sigma: %d',sigma),...
            sprintf('payload: %d',payload),...
            sprintf('eta: %.2f',eta),...
            sprintf('uE: %.2f',uExhaust)})

% compare to higher payload
payload  = 10000;   % kg
DV = [];
massFrac = [];
for j = 1:length(nYears)
  duration = nYears(j)*year;
  for k = 1:length(powers)
    thrust = 2*powers(k)*eta/(uExhaust*1e3);
    mFuel = thrust/(uExhaust*1e3)*duration;
    mEngine = powers(k)/sigma;
    DV(j,k) = DVConstantThrust( thrust, payload+mEngine+sR*mFuel, mFuel, uExhaust, duration );
  end
end
hold on
plot(powers/1e6,DV/1e3)

% compare to higher payload
payload  = 50000;   % kg
DV = [];
massFrac = [];
for j = 1:length(nYears)
  duration = nYears(j)*year;
  for k = 1:length(powers)
    thrust = 2*powers(k)*eta/(uExhaust*1e3);
    mFuel = thrust/(uExhaust*1e3)*duration;
    mEngine = powers(k)/sigma;
    DV(j,k) = DVConstantThrust( thrust, payload+mEngine+sR*mFuel, mFuel, uExhaust, duration );
  end
end
hold on
plot(powers/1e6,DV/1e3)


% theoretical limit
DVmax = uExhaust*log((1+sR)/sR);
yy = axis;
plot(yy(1:2),DVmax*[1 1],'k--')

ll = legend(ls.h,num2str(nYears'),'Location','southeast');
ll.Title.String = 'Years';


%--------------------------------------
% $Date$
% $Id: 153411224462346cd3ac105b05fd3726d6842e28 $
hs =

  Figure (Plot2D) with properties:

      Number: 1
        Name: 'Attainable DV'
       Color: [0.94 0.94 0.94]
    Position: [468 345 560 420]
       Units: 'pixels'

  Use GET to show all properties


ls =

  struct with fields:

    h: [7×1 Line]